INTRODUCTION
Cleavage Under Targets and Release Using Nuclease (CUT&RUN) was developed by Steve Henikoff in 2016 and represents an in situ alternative to ChIP-seq for genome-wide chromatin profiling.1 CUT&RUN has advantages over ChIP-seq, such as lower cell number requirements, lower sequencing depth requirements, and higher signal-to-noise.2 The ability to work with cells under native conditions can help avoid crosslinking artifacts or epitope masking due to fixation. In CUT&RUN, a fusion of protein A, protein G, and micrococcal nuclease (pAG MNase) is used to selectively cleave antibody-targeted chromatin in immobilized and permeabilized cells or nuclei. Cleaved chromatin fragments are allowed to diffuse out of cells, where they can be isolated from the supernatant. Purified DNA is then processed for standard library preparation, followed by next-generation sequencing. Due to the requirement of live cells, lightly fixed cells, or cryopreserved cells, CUT&RUN is arguably technically more challenging to perform and requires careful optimization and quality control. Multiple factors must be considered for the successful completion of CUT&RUN experiments. Cell populations must contain a high proportion of viable cells; however, lightly fixed cells can be used for certain applications. The number of cells must be carefully selected to ensure efficient cell conjugation to magnetic Concanavalin A beads, and permeabilization must be optimized to allow pAG-MNase to diffuse into cells without causing cell lysis.
Since its development, CUT&RUN has become a widely used method and has led to its commercialization by various life science companies. Reagents are provided as kits and can be combined with universal library prep methods and antibodies from third parties, followed by next-generation sequencing. Here, we evaluated three currently commercially available CUT&RUN kits from Active Motif, Cell Signaling Technology, and EpiCypher. To facilitate side-by-side comparisons, we used the same antibody, library preparation kit, and sequencing platform for all three chemistries. We compared datasets generated for well-defined histone marks: H3K4me3, which is known to have a narrow distribution range typically at active and paused promoters, and H3K27me3, which marks broad inactive regions of the genome.3–5
MATERIALS & METHODS
Cell Culture & Sample Preparation
Human HEK293T embryonic kidney cells were cultured in DMEM (Gibco) supplemented with 10% fetal bovine serum (Avantor), MEM nonessential amino acids (Gibco), and 50 units/ml penicillin/streptomycin (VWR). Cells were incubated under a 5% CO2 atmosphere at 37 °C and grown in 10-cm plates (Thermo Scientific™ BioLite™) until reaching 80-90% confluence before cryopreservation or prior to proceeding directly to CUT&RUN. Adherent HEK293T cells were washed with phosphate-buffered saline (PBS) prior to trypsinization with 0.05% trypsin for one minute. The cells were subsequently collected by centrifugation at 1,100 rpm for 5 minutes at room temperature, resuspended in culture media supplemented with 10% DMSO, and slowly frozen in an isopropanol-filled container at -80 °C. The cells were stored at -80 °C for one to two weeks prior to thawing in a 37 °C water bath. Prior to CUT&RUN, the cells were resuspended in PBS, mixed with an equal volume of 0.4% Trypan blue, and quality-checked for viability using the Countess II (Invitrogen, Thermo Fisher Scientific) automated cell counter.
CUT&RUN, library preparation and sequencing
HEK293T cells (1 × 10⁵ and 5 × 10⁵) were processed for CUT&RUN using the EpiCypher CUTANATM ChIC/CUT&RUN Kit (Version 3, Cat. # 14-1048), the Cell Signaling Technology CUT&RUN Assay Kit (Cat. #86652) and the Active Motif ChIC/CUT&RUN Assay Kit (Cat. #53180) following the manufacturer’s instructions. For all three kits, we used 2 μg of rabbit IgG antibody (Diagenode, Cat. #C15410206) as our negative control, 1 μg of anti-H3K4me3 polyclonal antibody (Diagenode, Cat. #C15410003), and 1 μg of anti-H3K27me3 polyclonal antibody (Diagenode, Cat. #C15410195). A quality check by light microscopy was performed after the cell suspension was combined with Concanavalin A beads to confirm the degree of cell-bead conjugation. Yeast spike-in DNA (S. cerevisiae, Cell Signaling Technology) was added at 0.5% to each reaction following chromatin digestion.
Affinity-enriched DNA (3 ng) was prepared for library construction using the SMARTer ThruPLEX Plasma-seq Kit (Takara Bio, Cat. #R400681) with dual indices (Takara Bio, Cat. #DX34752) according to the manufacturer’s protocol. Adapter-ligated libraries were amplified with 11 cycles of PCR, and the resulting amplified DNA was purified using AMPure XP beads (Beckman Coulter) and assessed for fragment size distribution using an Agilent 2100 Bioanalyzer. Finally, the molar concentration of each library was determined by quantitative PCR using the KAPA Library Quantification Kit (Roche) before pooling for sequencing on an Illumina NovaSeq 6000, with a paired-end 150 bp run.
ATAC-seq, library preparation, and sequencing
ATAC-seq libraries were prepared using the Active Motif ATAC-seq Kit (Cat# 53150) according to the manufacturer’s protocol. Briefly, 50,000 HEK293T cells were collected, washed once with ice-cold PBS, and resuspended in ATAC lysis buffer. The cells were immediately spun down at 3,000 rpm for 10 minutes at 4 °C to collect the nuclei. The nuclei were resuspended in Tagmentation Master Mix (2x Tagmentation Buffer, 10x PBS, 1% digitonin, 10% Tween 20, and Tn5 transposase) and incubated at 37 °C for 30 minutes on a thermomixer. This was followed by DNA extraction and purification using columns. The purified DNA was amplified using i5 and i7 index primers for 10 cycles. The resulting libraries were cleaned, size-selected with SPRI beads, and quantified by Qubit. The libraries were assessed for their fragment size distribution with an Agilent 2100 Bioanalyzer. The ATAC-seq libraries were sequenced on an Illumina NovaSeq 6000 platform using a paired-end 150-bp run targeting approximately 70 million read pairs.
Data Analysis
Prior to analysis, all libraries were downsampled to six million read pairs. The downsampled FASTQ files of H3K4me3 and H3K27me3 libraries were processed separately using the nf-core/cutandrun pipeline (version 3.2.2) with “–normalisation_mode Spikein –macs2_narrow_peak true –genome GRCh38 –spikein_genome R64-1-1 –peakcaller MACS2” and “–normalisation_mode Spikein –macs2_narrow_peak false –genome GRCh38 –spikein_genome R64-1-1 –peakcaller MACS2” parameters, respectively.6 In parallel with their respective IgG background controls. Sequence statistics were generated with FastQC (version 0.12.1). Adapter and quality trimming were performed using Trim Galore (version 0.6.6). The reads were then aligned to the human reference genome GRCh38, and spike-in reference genome R64-1-1, using Bowtie2 (version 2.4.4).7 The alignment metrics were obtained using SAMtools (version 1.17), and duplicate reads were marked with Picard (version 3.1.0). Peak calling was performed with normalized (based on spike-in alignment) data using MACS2 (version 2.2.7.1)8 against the respective IgG controls with a minimum FDR9 of 0.01 and broad calling (–broad) specified for H3K27me3.
Peak Quality
The peak calling output from MACS2 was imported into R as a GRanges object (GenomicRanges version 1.56.2) for further processing. The count of read fragments found within peak ranges was obtained using the alignment files and chromVAR (version 1.26.0). The FRiP scores were then calculated as the fragment count divided by the total number of mapped reads, as determined by Picard (version 3.1.0). Read pileup was extracted from peak regions centered around 3,000 bp windows, each with 50 bp bins, using the seqsetvis package (version 1.24.0). The pileup value per bin was normalized to reads per million (RPM), and subsequently aggregated by means to visualize the signal over the 3,000 bp window. The irreproducible discovery rate (IDR) framework was employed to assess the consistency and reproducibility of replicates using the IDR program (version 2.0.3) (22). The IDR values were ranked from highest to lowest and computed for each replicate pair.
Peak Annotation
Peaks were annotated with GRCh38.p14 (GENCODE release 44) using ChIPseeker (version 1.41.1)10,11 With the promoter region defined as +/- 1,000 bp from the transcription start site (TSS).
ATAC-seq
Raw reads from an ATAC library were processed within the Singularity containers pulled by the nf-core/cutandrun pipeline to analyze the CUT&RUN dataset. In short, Trim Galore (version 0.6.6) was used for adapter and quality trimming, Bowtie2 (version 2.4.4) was used for alignment to GRCh38, and MACS2 (version 2.2.7.1) was used for peak calling. The peak calling results for the ATAC library were imported as a GRanges object and merged with the CUT&RUN peak ranges to estimate the specificity of the target enrichment.
Statistical Tests
Reported p-values for observed differences between the three protocols were generated using the Kruskal-Wallis test followed by pairwise comparisons using the Wilcoxon test, with eight replicates per group. Technical replicates from four different conditions were combined for this analysis. Mean (median) and standard deviation values are reported as “(Mean ± SD)”.
RESULTS
Experimental Design
For a comparison of kit performance, we used identical lots of anti-H3K4me3 and anti-H3K27me3 antibodies, the same library construction kit, and uniform sequencing across all kits (Suppl. Fig. 1A). For each histone mark, we tested 100,000 and 500,000 cells and compared libraries made from fresh and cryopreserved cells. The number of PCR cycles was kept constant for all libraries during DNA amplification. Two technical replicates were generated for each condition. Our sequencing data were evaluated for library complexity, signal quality, accuracy, and reproducibility using community tools (Suppl. Fig. 1B). Each IP was analyzed in parallel with a negative IgG background control.
Library Quality
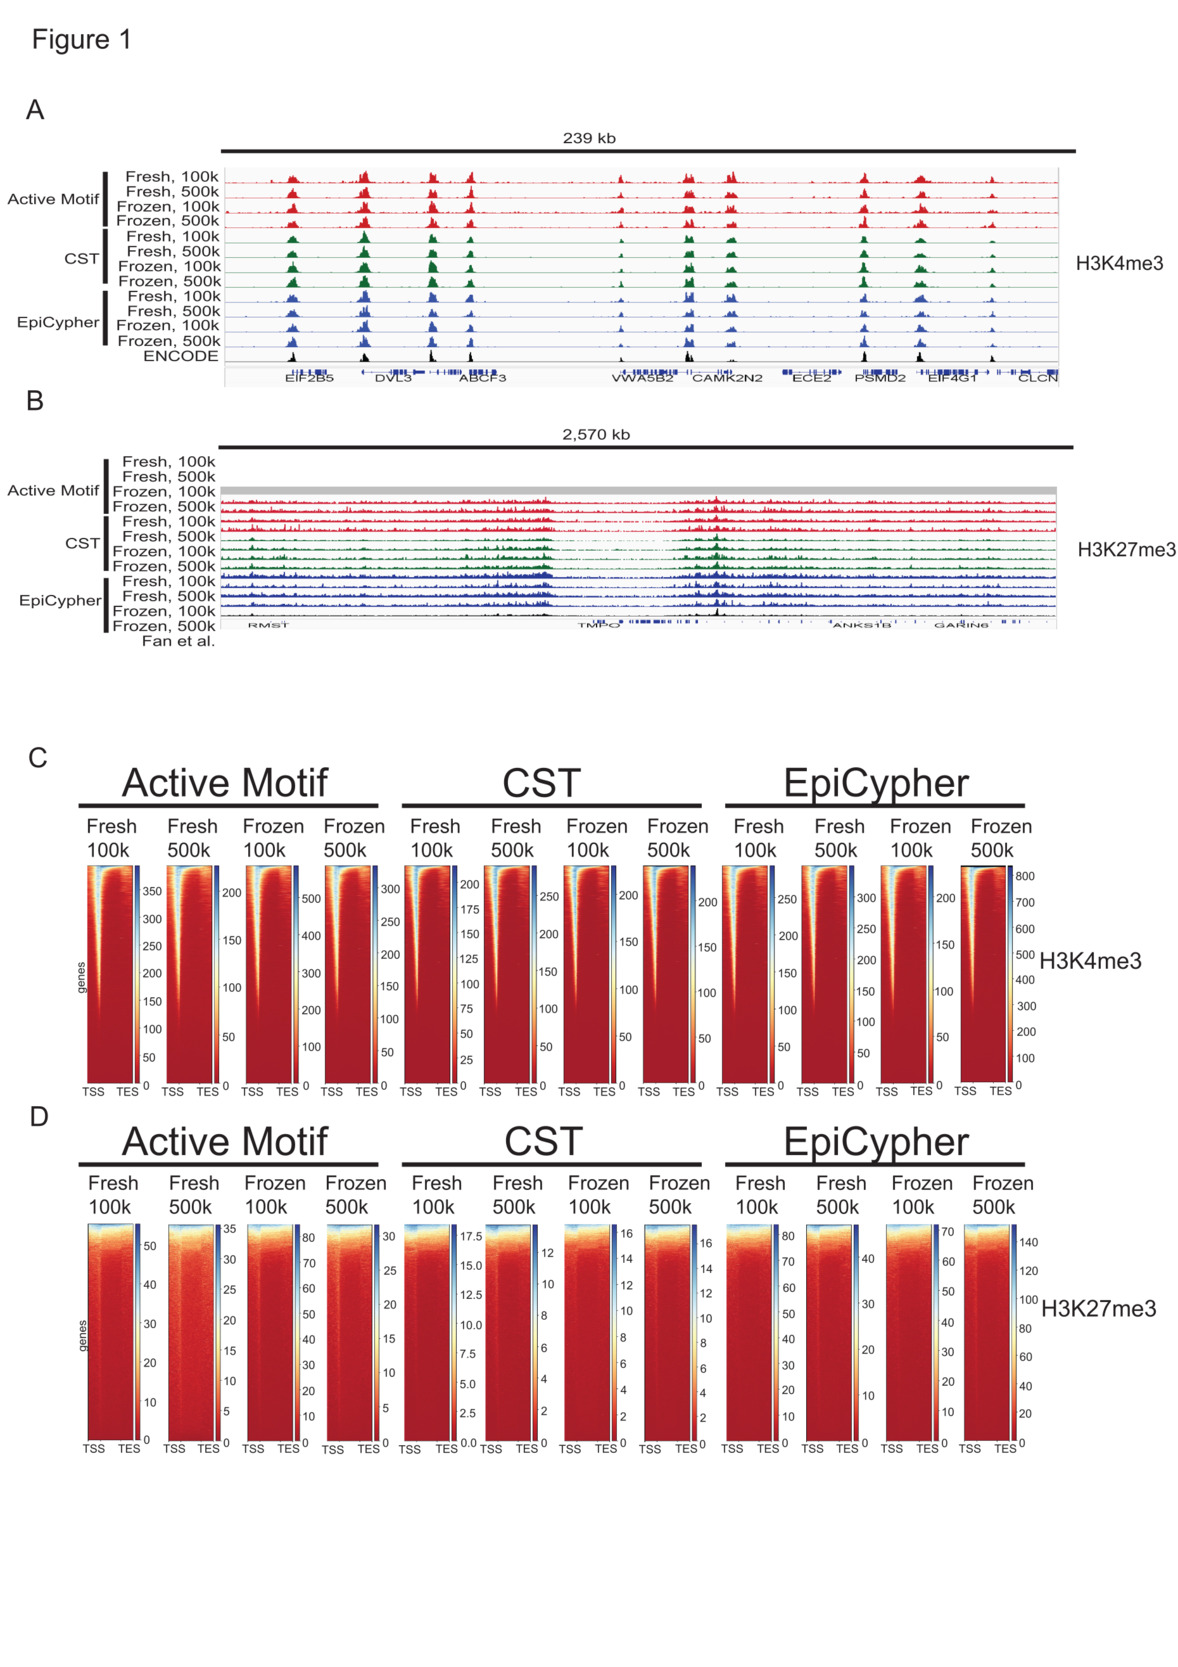
An analysis of library insert sizes revealed that the library fragments sequenced were predominantly mononucleosome-sized for all libraries (Suppl. Fig. 2A), and custom tracks showed reproducible peaks in alignment with those of other published12 or ENCODE (ENCSR372WXC) ChIP-seq datasets (Fig. 1A & B). The H3K4me3 distribution was generally narrow across gene promoters (Fig. 1C, Suppl. Fig. 3A), whereas H3K27me3 was broadly distributed across gene bodies (Fig. 1D, Suppl. Fig. 3B), consistent with other reports.12,13
**_autoscaled_custom_tracks_representing_the_cut_run_read_di.png)
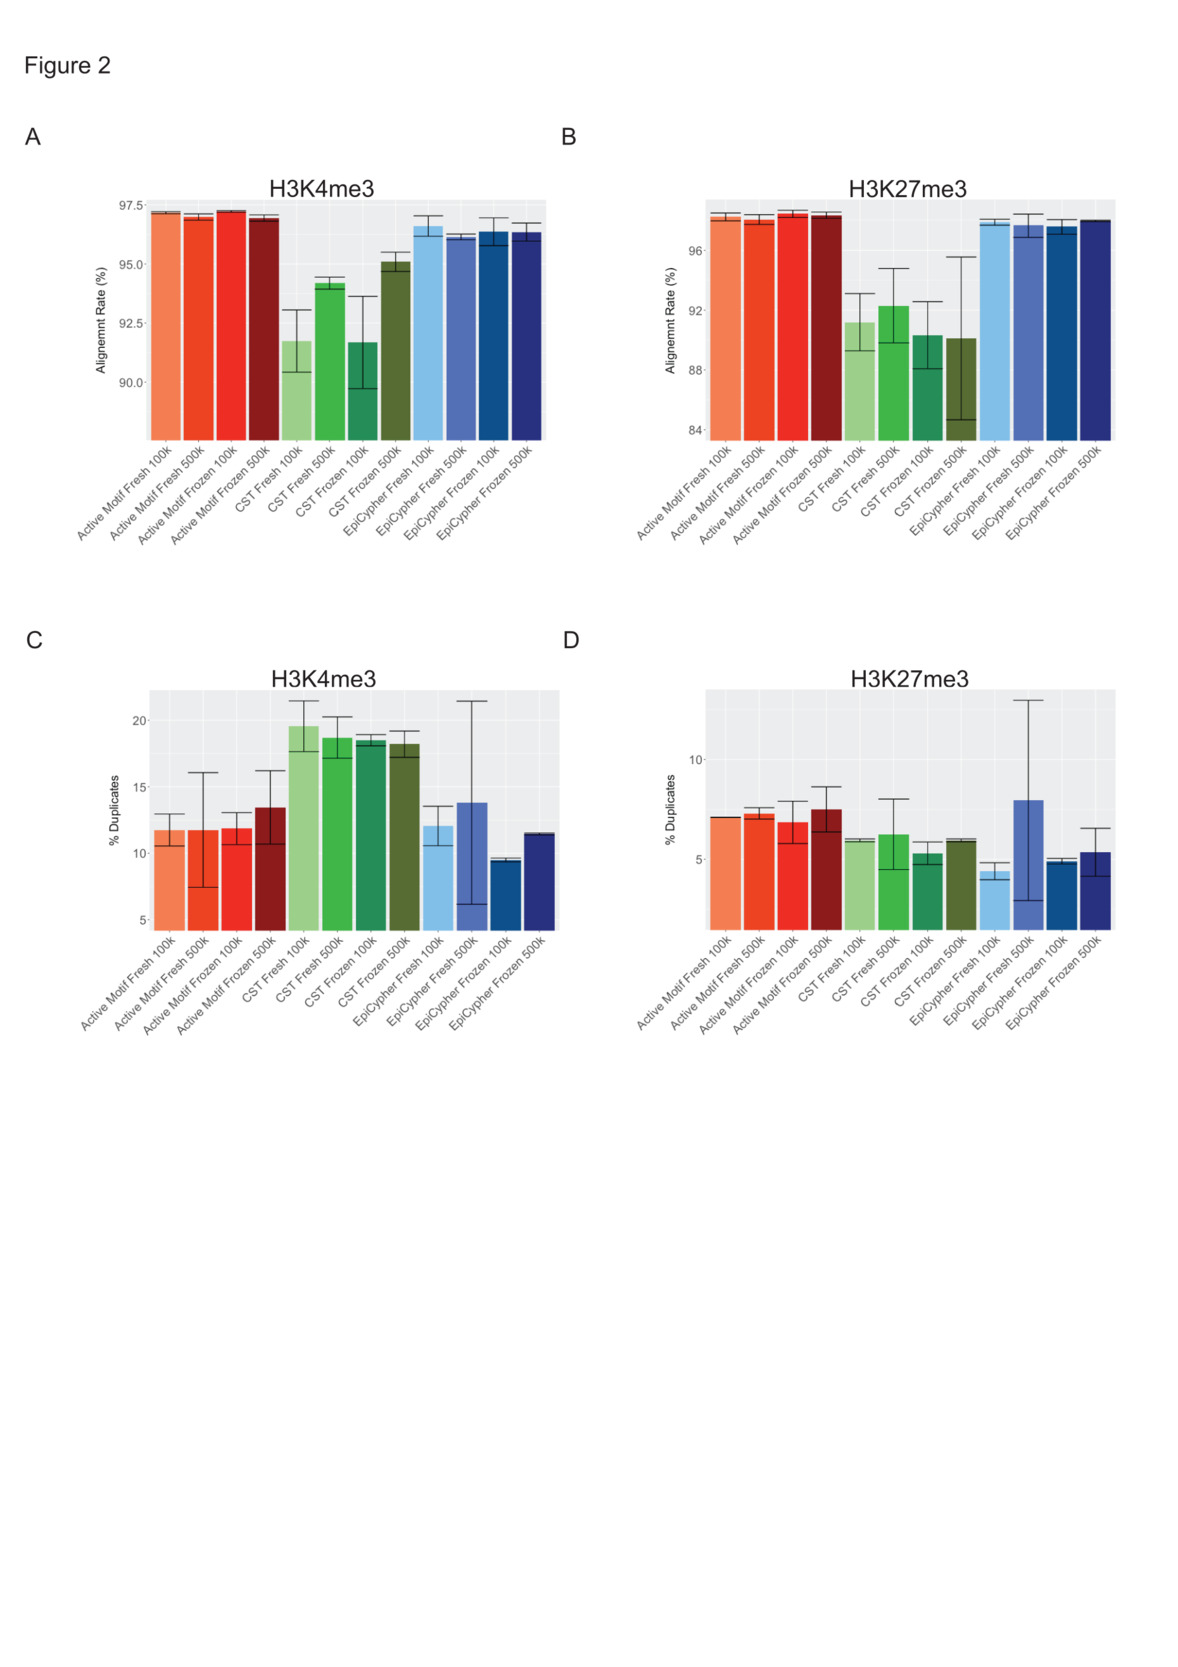
Read quality control of H3K4me3 libraries revealed significant differences (p < 0.0001, n = 8) among the three protocols, with the highest alignment for libraries generated with the Active Motif Kit (97.1% ± 0.15), followed by EpiCypher libraries (96.4% ± 0.36), and lower alignment with reads from CST libraries (93.2% ± 1.84) (Fig. 2A, Suppl. Table 1, Suppl. Table 2). Similarly, for the H3K27me3 libraries, the mapping rates were significantly different (p < 0.0005, n = 8) among the three protocols. They were highest for the Active Motif libraries (98.2% ± 0.25), followed by the EpiCypher libraries (97.7% ± 0.38) and lowest for the CST libraries (91.0% ± 2.69) (Fig. 2B, Suppl. Table 1, Suppl. Table 2). Among H3K4me3-CST libraries, alignment rates increased from 92% to 94% when libraries were generated with 500,000 cells over libraries made with 100,000 cells.
When PCR duplication rates from trimmed reads of H3K4me3 libraries were compared, statistically significant differences (p < 0.005, n = 8) were found among the three protocols. Duplication rates were highest in the CST libraries (18.7% ± 1.15), followed by Active Motif (12.2% ± 2.18) and EpiCypher (11.7% ± 3.37) H3K4me3 libraries, suggesting that more identical molecules were converted and that the complexity of the CST libraries was lower (Fig. 2C, Suppl. Table 1, Suppl. Table 2). Among the H3K27me3 libraries, Active Motif (7.19% ± 0.65) had higher (p < 0.05, n = 8) duplication rates than did CST (5.86% ± 0.80) and EpiCypher (5.65% ± 2.44) (Fig. 2D, Suppl. Table 1, Suppl. Table 2). No significant differences in duplication rates were detected between fresh and frozen cells or between 100,000 and 500,000 cells. In summary, our analysis of read alignment and distribution confirmed that our histone targets consistently localized to the anticipated genomic loci. Within the H3K4me3 library cohort, CST libraries featured lower mapping rates and higher PCR duplication rates when compared to libraries generated with Active Motif and Epicypher kits.
**_bar_graphs_showing_alignment_rates_following_a.png)
Signal Quality
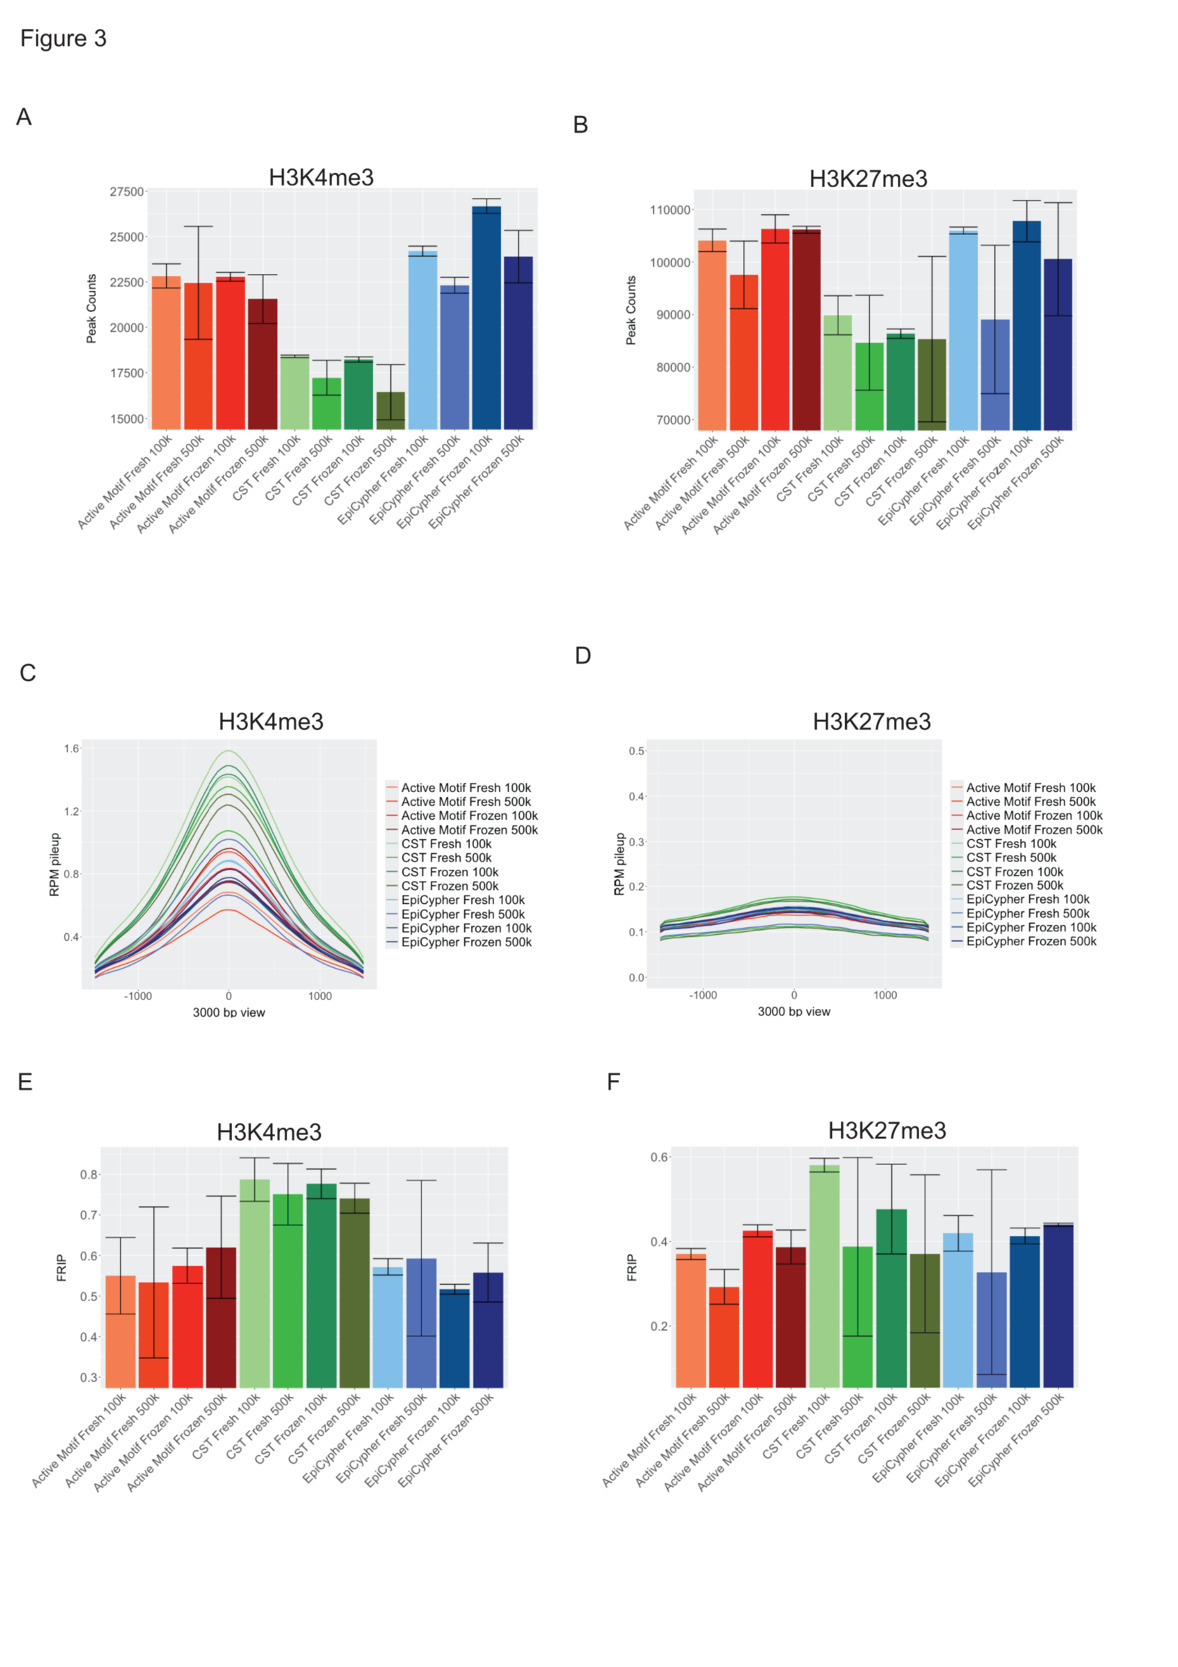
To assess signal quality, we evaluated the number of peaks called, the peak amplitude and the signal to background ratio. Overall, we detected significantly lower (p < 0.0005, n = 8) H3K4me3 peak numbers in CST (17,569 ± 1,087) libraries, with higher peak numbers detected in libraries generated with the EpiCypher (24,275 ± 1,775) and Active Motif (22,404 ± 1,421) workflows (Fig. 3A, Suppl. Table 1, Suppl. Table 2). The CST (86,373 ± 5.535) libraries also featured significantly lower (p < 0.05, n = 8) H3K27me3 peak numbers than did the EpiCypher (100,842 ± 10,404) and Active Motif (101,381 ± 5,565) libraries (Fig. 3B, Suppl. Table 1, Suppl. Table 2). Among H3K4me3 CST and EpiCypher but not Active Motif libraries, we observed slightly higher peak numbers in 100,000 cell-libraries (22,186 ± 916) than in libraries generated from 500,000 cells (20,645 ± 916). Cryopreservation had no significant effect on peak numbers. H3K27me3 peak numbers exhibited greater variance, and we did not detect any significant differences between cell numbers or cell preparations.
Despite exhibiting lower peak numbers, the CST-H3K4me3 libraries clearly presented the strongest signal based on normalized read pileup (Fig. 3C). H3K27me3 libraries displayed only slight differences in signal amplitude. H3K27me3 libraries with the highest and lowest cumulative signals were represented by CST (Fig. 3D). The FRiP (fraction of reads in peaks) score is a crucial measure of signal over background for ChIP-seq, CUT&RUN and ATAC-seq datasets, and represents the fraction of mapped reads that fall into peak regions.9 ENCODE benchmarks FRiP scores for high-quality datasets at greater than 0.3, and datasets with FRiP scores higher than 0.2 are considered acceptable. Analysis of the FRiP scores revealed that the scores for the H3K4me4 dataset were significantly higher (p < 0.001, n = 8) in the CST libraries (0.764 ± 0.05) than in the EpiCypher (0.56 ± 0.08) and Active Motif (0.57 ± 0.1) libraries but not different between the latter two (Fig. 3E, Suppl. Table 1, Suppl. Table 2). The FRiP scores computed for the H3K27me3 libraries were slightly higher in the CST libraries (0.45 ± 0.15) than in the Active Motif (0.37 ± 0.06) and EpiCypher (0.40 ± 0.10) libraries (Fig. 3F, Table 1, Suppl. Table 2). The H3K4me3 and H3K27me3 libraries generated using the CST kit and 100,000 cells yielded higher FRiP scores than those generated with 500,000 cells using the CST kit. Collectively, our data revealed differences in peak number and quality between the three chemistries tested, with higher peak numbers represented by the Active Motif and EpiCypher workflows and stronger signal-to-background generated by the CST workflow.
**_box_plots_showing_the_number_of_macs2-called_peaks._th.png)
Reproducibility
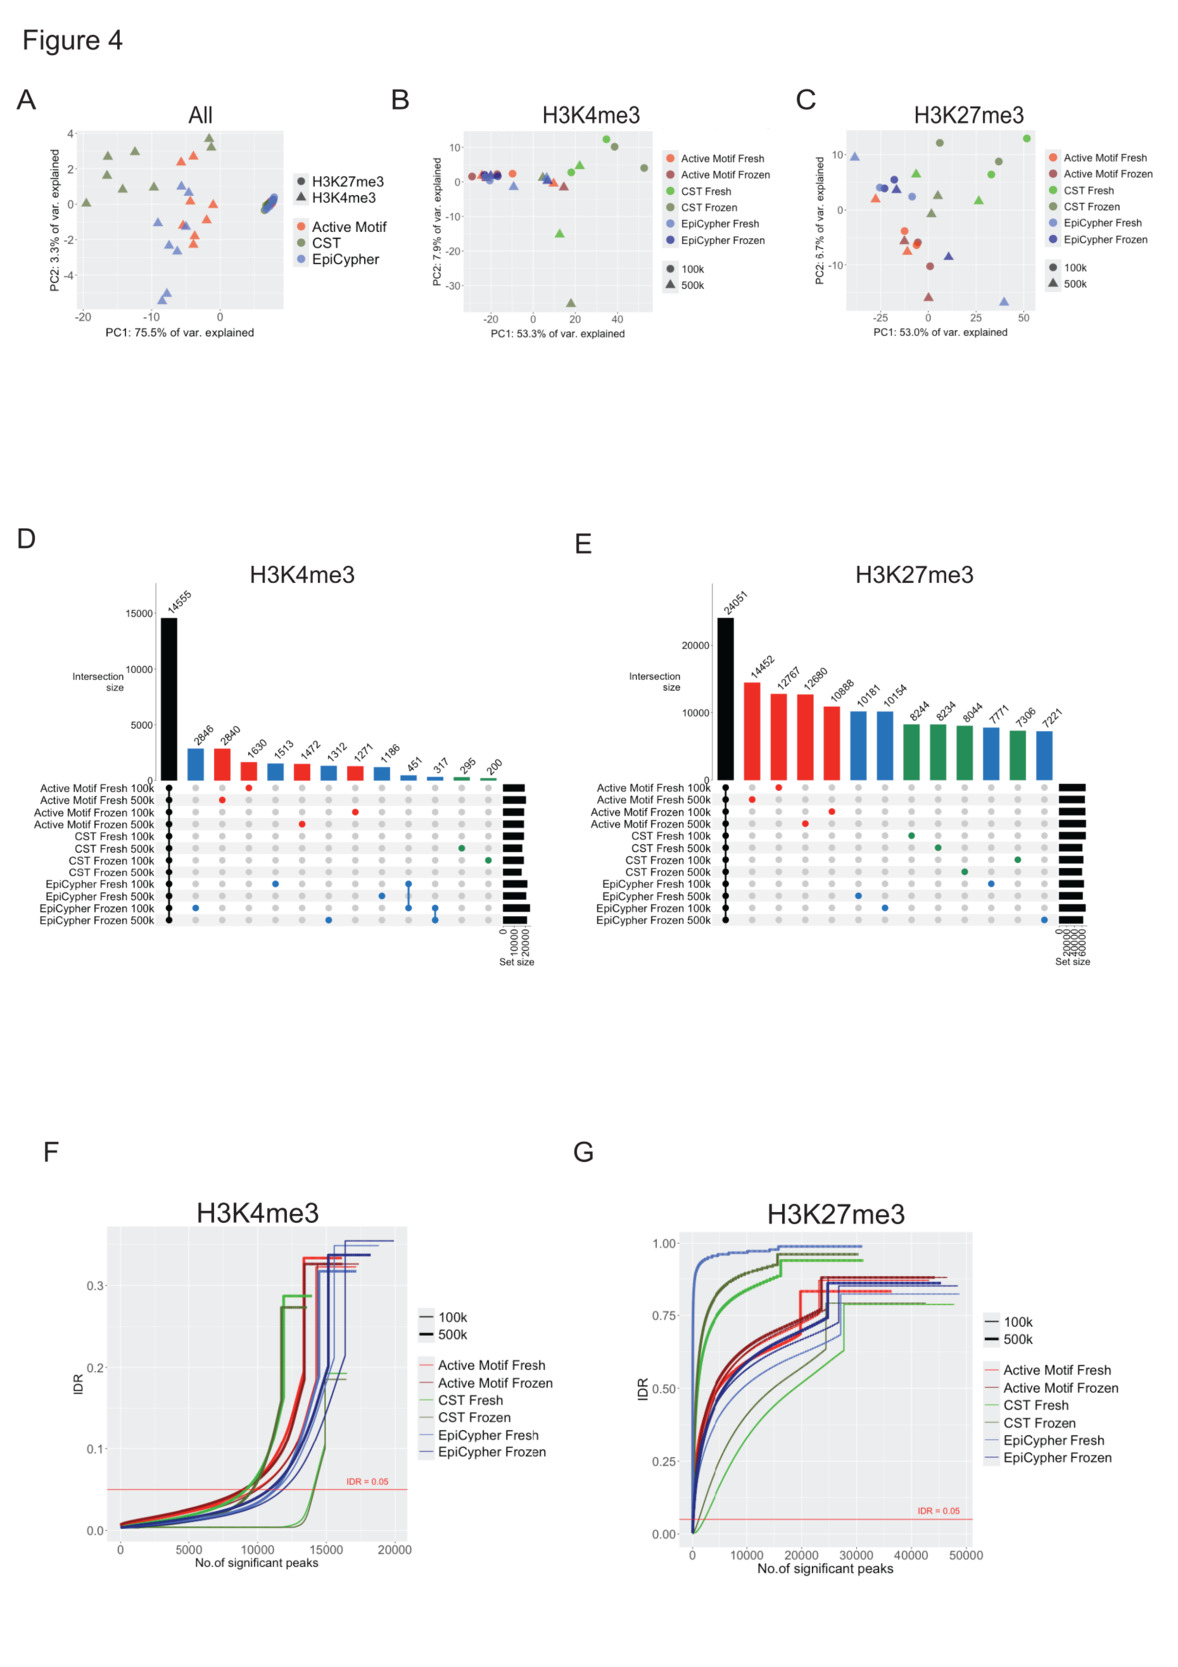
Hierarchical clustering based on peak distribution and signals revealed that samples clustered primarily by histone target (Suppl. Fig. 2 B). To further estimate the heterogeneity of our datasets, a principal component analysis (PCA) was conducted. The H3K27me3 and H3K4me3 libraries formed distinct clusters with secondary separation by chemistry (Fig. 4A). The H3K27me3 libraries clustered more tightly than the H3K4me3 libraries did, demonstrating lower variance in signal amplitude among the H3K27me3 libraries in accordance with our read pileup analysis. When analyzed separately, the H3K4me3 (Fig. 4B) and H3K27me3 (Fig. 4C) libraries exhibited slight clustering by chemistry. Among the CST libraries, the 100K and 500K libraries also clustered, suggesting that the number of cells was a driver of variance in the CST workflow. Analysis of H3K4me3 peak overlap revealed that approximately 37% of the peaks detected were common to all 12 conditions; 22% of peaks were unique to the EpiCypher, 19% of the peaks were unique to the Active Motif, and 2% of peaks were uniquely detected in CST libraries (Fig. 4D). Approximately 11% of the H3K27me3 peaks were shared across all 12 conditions. A large number of chemistry-unique peaks were detected, with almost 24% produced by the Active Motif chemistry, followed by 17% produced by EpiCypher and 15% produced by the CST libraries, illustrating the challenge of detecting high-confidence H3K27me3 peaks (Fig. 4E).
To assess the concordance of peak calls between technical replicates, we performed an irreproducibility discovery rate (IDR) analysis. Among the H3K4me3 libraries, the CST libraries presented the highest concordance, followed by the EpiCypher and Active Motif libraries (Fig. 4F). For all replicate pairs, and most notably for CST libraries, fidelity improved in libraries generated with 100,000 cells compared with libraries generated from 500,000 cells. CST-H3K4me3 libraries showed the greatest sensitivity for cell numbers with both the highest and lowest IDRs, with 100K and 500K libraries, respectively. Libraries from fresh and frozen libraries showed almost equal concordance. H3K27me3 libraries were characterized by much lower numbers of high-confidence peaks at any given IDR value (Fig. 4G). Nonetheless, we computed similar trends, with the highest fidelity in the CST-100K libraries, followed by the EpiCypher and Active Motif libraries, and lower reproducibility in the CST libraries generated from 500,000 cells. In summary, our analyses of data heterogeneity revealed that H3K4me3 libraries, despite exhibiting high variance in peak signals, share a greater number of peaks in common, and replicates share a higher number of high-confidence peaks than H3K27me3 libraries do. We found that the CST libraries presented the highest proportion of peaks shared with the other libraries. Reproducibility consistently improved at lower input (100,000 cells).
**_pca_plots_based_on_peak_distribution._deeptools_(version_3.png)
Accuracy
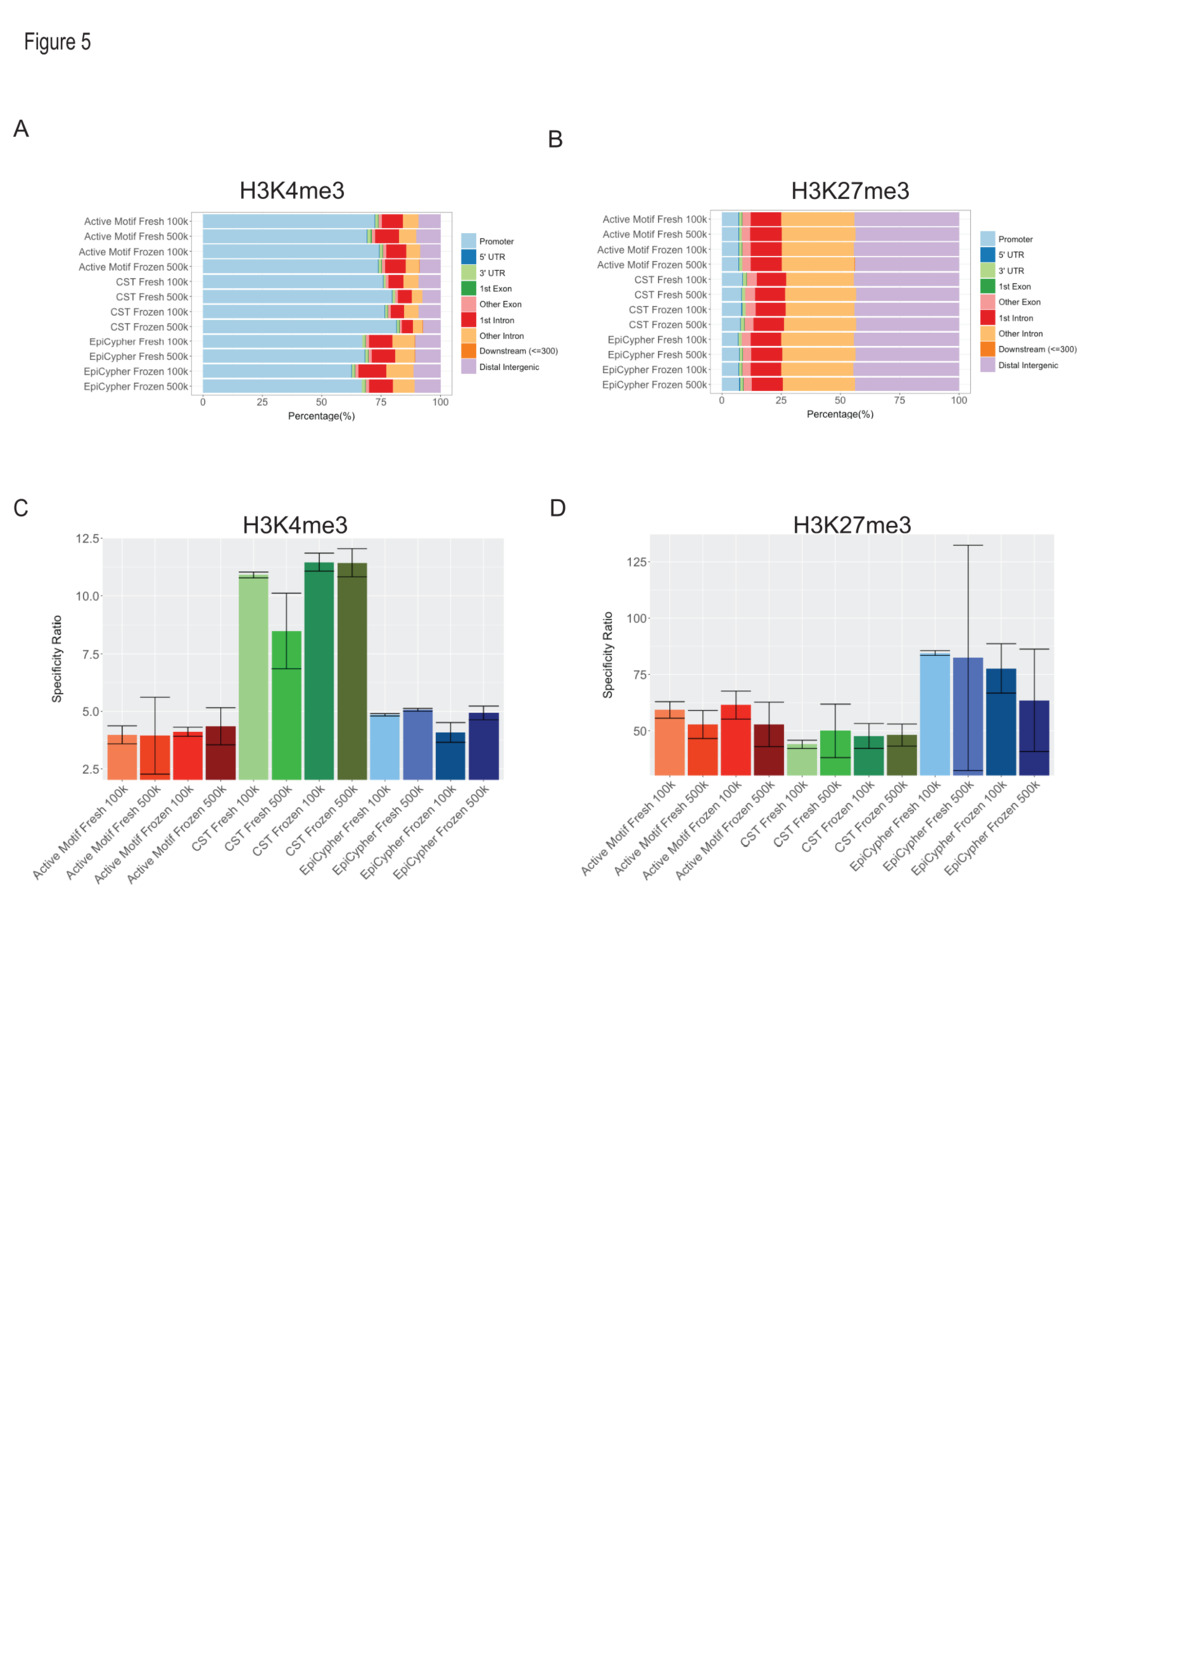
Given the association of H3K4me3 with accessible promoter regions and the association of H3K27me3 with inaccessible chromatin at genes and at intergenic regions, we examined peak localization and correlation with ATAC-seq as proxies for accuracy. To this end, we mapped the peaks to various genic, regulatory, and intergenic regions. We detected a higher percentage of CST-H3K4me3 peaks (78 ± 6%) that localized to promoters compared with Active Motif (73 ± 6%) and EpiCypher (67 ± 6%), with the remaining peaks mapping to intronic and intergenic regions (Fig. 5A). H3K27me3 peaks were mapped to both intergenic and genic regions, with only minor differences between libraries, and an expectedly lower frequency of peaks in promoters compared to those observed for H3K4me3 libraries (Fig. 5B).
To further assess accuracy, we integrated ATAC-seq data from the same cell line and assessed the overlap of ATAC-seq and CUT&RUN peaks. As expected, we observed a substantial percentage (83.4 ± 5.8) of H3K4me3 peaks that overlapped with ATAC-seq peaks, and a small percentage (1.6 ± 0.4) of peak overlap between H3K27me3 and ATAC-seq peaks (Suppl. Fig. 4A & B). We also observed a substantial percentage (70.8 ± 2.6) of unique ATAC-seq peaks without overlap of H3K4me3. These regions may be accessible chromatin regions that do not carry H3K4me3, such as most active enhancers,13,14 or where H3K4me3 is undetected due to the lower sensitivity of CUT&RUN compared to ATAC-seq. We considered peaks unique to H3K4me3 datasets as putative off-target peaks. In contrast, unique H3K27me3 peaks were considered on-target, given each mark’s association with accessible and inaccessible chromatin domains, respectively.15–19 Computation of “on” over “off” target peak ratios as a measure of accuracy revealed significantly greater (p < 0.0005, n = 8) accuracies of peak distribution from H3K4me3 libraries made with the CST Kit (10.6 ± 1.48) compared to Active Motif (4.10 ± 0.74) and EpiCypher (4.4 ± 0.45) (Fig. 5C). EpiCypher (77.0 ± 22.9) and Active Motif (56.6 ± 6.62) libraries featured significantly greater (p < 0.05, n = 8) accuracies of H3K27me3 peaks than did CST (47.4 ± 5.82) (Fig. 5D). Among Active Motif libraries, we calculated higher specificity ratios from libraries made with 100,000 cells (67.17 ± 3.67) than from libraries made with 500,000 cells (56.53 ± 7.00). In conclusion, these data suggest that the CST chemistry achieves greater accuracy in profiling H3K4me3, whereas EpiCypher and Active Motif feature greater accuracy in profiling H3K27me3.
**_peak_distribution_across_genomic_features._**(c-d)**_box_plots_wit.png)
DISCUSSION
Performance
CUT&RUN has become a widely used tool for epigenomic profiling. Here, we evaluated the performance of three commercial CUT&RUN kits. Table 1 summarizes the quality aspects tested here, which are pertinent to each kit’s performance. One takeaway from our study is that no single chemistry performed better for both histone PTM targets, and overall, all three chemistries generated high-quality libraries. Hence, selecting any one of the three kits is a viable option. We found that the CST workflow generated H3K4me3 libraries with the lowest noise and highest accuracy, albeit with lower complexity and lower number of reads mapped.
Mapping efficiency, the total number of reads that align, can be impacted by several factors, including read quality, fragment length following trimming, and contaminants. FASTQC analyses did not reveal any substantial differences in read quality, and the percentage of base pairs trimmed did not correlate with the alignment rate; hence, we suspect that introduced contaminants, such as bacterial DNA from carryover of bacterially produced enzymes, underlie the lower mapping rate of CST libraries. The lower complexity of the CST libraries was supported by observations of higher PCR duplication rates and fewer peaks called. Higher signal-to-background ratios were supported by stronger signals and higher FRiP scores. Superior accuracy was supported by a greater proportion of peaks in promoters and in accessible chromatin. The Active Motif and EpiCypher H3K4me3 libraries yielded more total and unique peaks, but at the expense of accuracy and signal quality. Across libraries from all three kits, we observed a significant variance in the H3K4me3 signal amplitude. Hence, increasing the number of replicates will strongly enhance statistical power, especially for quantitative comparisons. Despite variation in signal, peak-calling concordance was relatively high across all H3K4me3 libraries, with almost 40% of peaks shared between all libraries. CST libraries contributed the fewest unique peaks, indicating highest peak fidelity. Agreement between technical replicates was also highest in the CST libraries, but decreased significantly in the libraries prepared with 500,000 cells. Reproducibility was consistently high across the EpiCypher and Active Motif H3K4me3 libraries under various conditions, as evidenced by similar numbers of high-confidence peaks between technical replicates at low IDR values.
Despite having a much lower variance in peak signal, the H3K27me3 libraries featured a significantly lower percentage of high-confidence peaks, as shown by our IDR analysis, and a high percentage of unique peaks contributed by each chemistry. We expect similar behaviour for other broad marks with relatively modest signal. Since NGS is a sampling method, it is conceivable that, at least to some extent, deeper sequencing can mitigate variation and increase confidence in peak calling. Nonetheless, low peak quality, low technical reproducibility, and a relatively low percentage of high-confidence H3K27me3 peaks suggest that broad peaks central to a study’s conclusion should be followed up on by orthogonal validation, for example, by qPCR. To our knowledge, the availability of orthogonal, highly multiplexed, turnkey, yet customizable technologies for CUT&RUN or ChIP-seq remains limited and would be useful when validation is needed for more than a handful of loci. NanoString’s hybridization-based ChIP-STRING assay20 allows for the validation of up to 800 targets. Still, it is limited in its ability to start with only a relatively large amount of enriched DNA and may not be suitable for CUT&RUN. Among H3K27me3 libraries, we observed several notable differences in peak numbers, quality, and accuracy across the three kits. Peak-calling yielded fewer peaks in the CST libraries and higher numbers in Active Motif and EpiCypher libraries. CST libraries had a slightly higher FRiP score and had the highest percentage of shared peaks across all libraries. EpiCypher libraries generated a high number of peaks and exhibited a substantially higher on-target-to-off-target peak ratio than did the Active Motif and CST libraries. Hence, our rigorous examination showed that the CST kit performed better than EpiCypher and Active Motif for narrow and sharp histone PTMs. Our findings from a more variable H3K27me3 dataset indicate that higher accuracy can be achieved for broad marks by utilizing the Epicypher kit.
Sample Preparation
Using frozen cells, cryopreserved with our protocol, did not compromise data quality. Cryopreservation protocols for different cell types may differ, and some cell types are more susceptible to and more likely to be affected by freezing than others; hence, we advise viewing these results in the context of immortalized, easy-to-culture cell lines. Specifically, core facilities appreciate the ability to work with frozen cells, as they provide a safe stopping point for transferring cells from the customer’s laboratory to the core facility. The reproducibility between technical replicates was consistently greater with libraries made with 100,000 cells than with libraries made with 500,000 cells. The CST chemistry was most sensitive to different inputs, and libraries with 100,000 cells generated better libraries than did libraries with 500,000 cells, as underscored by a greater number of peaks, stronger peak signal, higher FRiP scores, and higher reproducibility displayed by libraries made with 100,000 cells. Hence, when using the CST kit, we recommend targeting close to 100,000 cells, even when abundant cells are available.
Practical Considerations
The overall workflow, processing, and hands-on times for all three workflows are presented in Supplemental Figure 5. The total processing time for each kit was approximately two days (excluding library preparation and sequencing). A notable advantage of the EpiCypher and Active Motif kits is that users prepare the wash buffer at the beginning of the protocol and use it throughout. In contrast, the CST kit requires the user to prepare the wash buffer fresh at each step, leading to increased hands-on time. Both the EpiCypher and CST reagents demonstrated excellent cell-bead conjugation with HEK293T cells, with typically 100% of cells conjugated with Concanavalin A. However, in our hands, Active Motif’s Concanavalin A beads did not bind as effectively to HEK293T cells, with approximately 85–90% of the cells associated with beads following the instructions of the protocol. This issue may result in lower yields of enriched DNA and may be factored into the cell count during sample preparation. Both the EpiCypher and Active Motif kits include DNA isolation and purification reagents, but they are not included in the CST CUT&RUN kit, which requires users to purchase these separately. Overall, the Active Motif and EpiCypher kits provided a slightly more user-friendly experience than did the CST kit because both kits include all the necessary reagents without the need to buy 3rd-party reagents. In our opinion, the EpiCypher manual provides the most user-friendly instructions. Specifically, quality control steps such as validation of cell viability, efficiency of cell permeabilization, and cell-ConA bead conjugation are illustrated with micrographs and helpful step-by-step instructions.
Limitations and Future Work
While our study was specifically designed for histone PTM profiling, we acknowledge that the performance of the tested kits may differ when applied to transcription factor profiling. Such applications are generally associated with lower signal intensities and frequently necessitate protocol modifications.21 Our results suggest that our choice of cell numbers was relatively conservative and that lower cell numbers may be processed successfully, although this was not tested here. Our study was restricted to the HEK293T cells, which are easily dissociated and maintain viability after cell dissociation. Many tissues can be challenging to dissociate and require specialized protocols to obtain single-cell suspensions; in such cases, nuclear isolation may be necessary. Vendors for all three kits provide general recommendations for processing tissue, and can also be contacted to inquire about internal datasets generated using various tissue types. Future studies may test fixed cells, primary cells, multiple tissue types, and nuclei. Logistically, we were unable to sequence all libraries on a single flow cell, and we felt that proceeding from library prep to sequencing promptly would reduce bias more than storing libraries for several weeks to enable sequencing on a single flow cell. Nonetheless, we cannot rule out minor batch effects from sequencing on separate flow cells. FASTQC reports were generated for all libraries and showed comparable read quality across runs.
Here, we integrated ATAC-seq data to assess the accuracy of the CUT&RUN peaks. We considered H3K4me3 peaks in inaccessible regions of the genome to be off-target. Importantly, H3K4me3 is almost always associated with open, accessible chromatin, but H3K4me3 sites on closed chromatin have been reported.16 Some cell types, specifically embryonic stem cells3 and T-cells4 Contain bivalently marked genes that carry both H3K4me3 and H3K27me3, which are generally considered accessible, complicating the relationship between H3K27me3 and chromatin accessibility. Nonetheless, given the established strong positive and negative correlations between H3K4me3 and H3K27me3, respectively, and chromatin accessibility, we believe that integrating ATAC-seq data is a valid genome-wide approach for assessing accuracy. A similar approach based on DNase I accessibility has been used to validate ChIP-seq datasets.22
CUT&TAG, a similar “cut and release” procedure with the advantage of generating sequencing-ready DNA fragments by Tn5 transposase-mediated adapter addition, can be used as an alternative to CUT&RUN, with a shorter protocol but generally results in a lower signal to background.23 The shorter processing protocol of CUT&TAG makes it more amenable to automation. Core facilities that process high sample volumes may consider processing on a liquid handler and opt for CUT&TAG over CUT&RUN. Testing of CUT&TAG protocols was outside the scope of this study, but is of interest for future studies. Overall, we believe this study will provide researchers interested in using commercial CUT&RUN solutions with valuable resources to guide their decision-making and experimental design.
Author Contributions
DCK conceived the project, designed the experiments, interpreted the data, and wrote the manuscript; KP designed and performed the experiments and helped write the manuscript; ET performed the experiments; and VR conducted the bioinformatics analyses and helped write the manuscript. All the authors read and approved the manuscript.
Funding/Support
This project was supported by the Cancer Prevention and Research Institute of Texas Core Facility Support Awards (RP250580) and NIH P30CA125123 grants. The funding agencies had no role in the design, collection, analysis, interpretation, or writing of the manuscript.
Availability of Data and Materials
FASTQ files have been deposited in the Gene Expression Omnibus (GEO) under accession numbers GSE306233 and GSE306141.
Statement of Financial Support/COI: We have no conflicts of interest to disclose.
Supplemental Figure Legends
Supplemental Figure 1. Experimental Design (A) Diagram outlining the experimental strategy for DNA enrichment, library construction, and high-throughput sequencing for comparison of three commercial CUT&RUN kits (Active Motif ChIC/CUT&RUN, Cell Signaling Technology CUT&RUN, and EpiCypher CUTANA ChIC/CUT&RUN Kit). For each protocol, different cell numbers (100,000/500,000) and samples prepared fresh or cryopreserved were compared. Affinity enrichment was performed with antibodies against H3K4me3 and H3K27me3. An anti-IgG antibody was used to generate nonspecific background control libraries. The enriched DNA was processed with the Takara ThruPLEX Plasma-seq Kit before next-generation sequencing. (B) Diagram outlining the central data processing and analysis steps. Downsampled read files were processed before read quality control, alignment, and peak calling. Peaks were analyzed for signal quality and reproducibility using various bioinformatics tools and the R package. ATAC-seq data were integrated into the analysis and compared to the CUT&RUN peak distribution to measure the accuracy of each CUT&RUN dataset.
Supplemental Figure 2. (A) Fragment length distribution plot based on mapped paired-end reads showing predominantly mononucleosomal peaks of approximately 150–180 bp in length. (B) Heatmap and hierarchical clustering based on read distribution.
Supplemental Figure 3. (A) Profile plots displaying the average H3K4me3 signal distribution based on normalized, stacked reads. (B) Profile plots displaying the average H3K27me3 signal distribution based on normalized, stacked reads.
Supplemental Figure 4. (A) Venn diagrams showing overlap between H3K4me3 peaks and ATAC-seq peaks. (B) Venn diagram showing overlap between H3K27me3 peaks and ATAC-seq peaks.
Supplemental Figure 5. Flow chart illustrating the key steps of the protocol from enrichment to library preparation. Hands-on time experiences are highlighted.